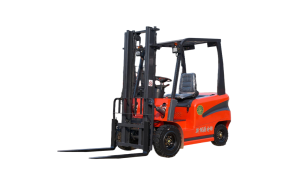
Every forklift leaves the factory with a data plate that states a rated capacity. That number is real, but it is also conditional. It assumes a specific load center, a specific lift height, a specific mast, and no attachment bolted to the carriage. Change any one of those variables and the true lifting power of the truck changes with it. In my work as a Product Applications Specialist at LT-Forklift, the single most common source of expensive mistakes is a buyer comparing two forklifts by their headline tonnage, then discovering on site that the machine cannot pick up the load it was purchased for.
This guide walks through the full picture of load capacity and derating: what the data plate really tells you, why load center matters more than most buyers realize, how lift height quietly steals capacity, how attachments reshape the entire capacity curve, and how to benchmark a realistic commercial budget. If you want the short version: the chart on the data plate is a promise made at one point in space, and every deviation from that point is a negotiation. Let me show you how to win that negotiation.
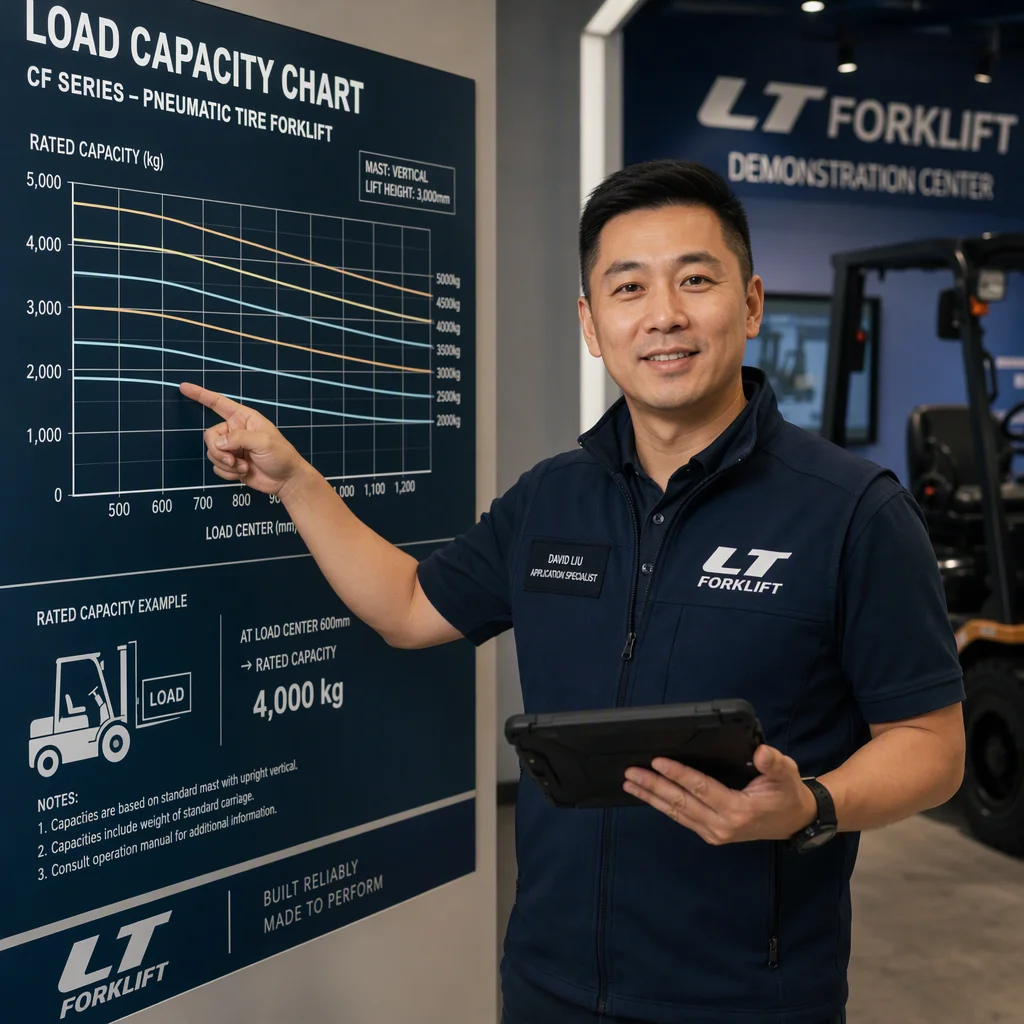
Why the Data Plate Is Only the Beginning
The capacity plate on a counterbalance forklift is not a marketing document. In regulated markets it is a legal statement derived from stability testing, and it must remain readable and accurate on the truck. It typically lists the rated load for a defined load center (600 mm / 24 in is the industry default) at a defined maximum lift height, with a specific mast and carriage configuration. The moment you add an attachment or raise the load beyond the tested height, the plate is describing a truck you no longer have.
I tell customers to treat the data plate as the opening position of a conversation, not the final answer. Two forklifts can both say “3,000 kg” on paper and behave completely differently once a 1,200 mm load center or a 4,500 mm lift height enters the picture. What buyers actually need is a capacity chart that plots residual capacity across a range of load centers and heights. That chart, not the single number on the plate, is what should drive a purchase decision.
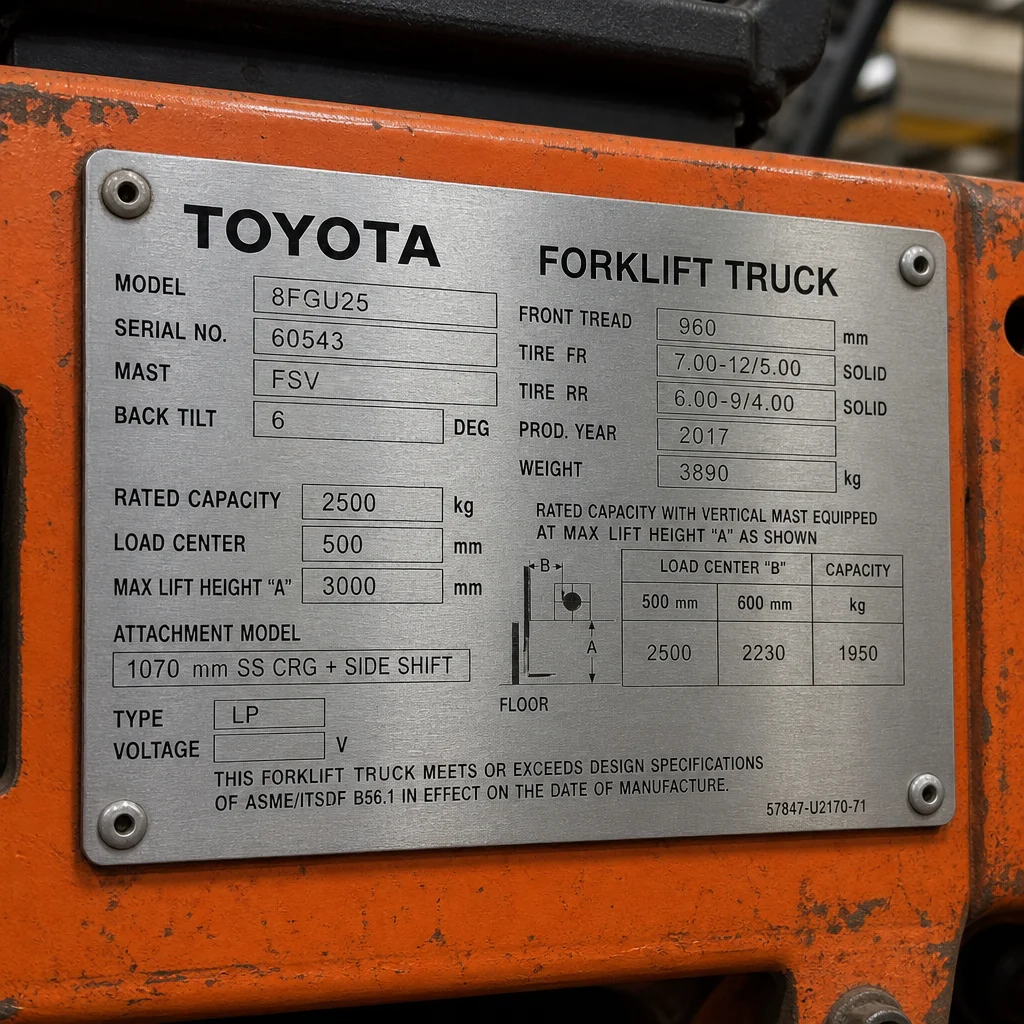
There is a regulatory reason the plate is not optional. In the United States, employers must ensure that powered industrial trucks are used in accordance with the manufacturer’s capacity and stability requirements, and any modification that affects capacity requires the plate to be updated accordingly. You can read the primary source directly: OSHA 1910.178 forklift data plate regulations. Elsewhere in the world, the equivalent expectation is captured by stability and verification standards such as ISO 3691-1 stability verification standards, which define how a manufacturer proves a truck stays stable under rated and off-center loads.
Load Center: The Measurement That Quietly Reduces Your Capacity
Load center is the horizontal distance from the front face of the forks to the center of gravity of the load. It is the single most powerful lever on real lifting capacity, and it is the one buyers most often ignore. A forklift is a lever balanced on a fulcrum at the front axle. The heavier the load and the further it sits from that fulcrum, the greater the tipping moment. Rated capacity is simply the maximum weight the manufacturer has proven stable at the rated load center.
The Load Center Derating Formula
The physics is straightforward once you strip it back. The moment (force times distance) that the truck must resist scales linearly with the load center. If a truck is rated for 3,000 kg at a 600 mm load center, then the resisting moment at rated capacity is roughly the same when the load is lighter but further out. A practical approximation many engineers use for early-stage sizing is: allowable load = rated load × (rated load center ÷ actual load center). Using that rule, a 3,000 kg truck at 600 mm drops to about 1,800 kg of allowable load at a 1,000 mm load center, and to about 1,286 kg at a 1,400 mm load center, before any height or attachment penalties are applied.
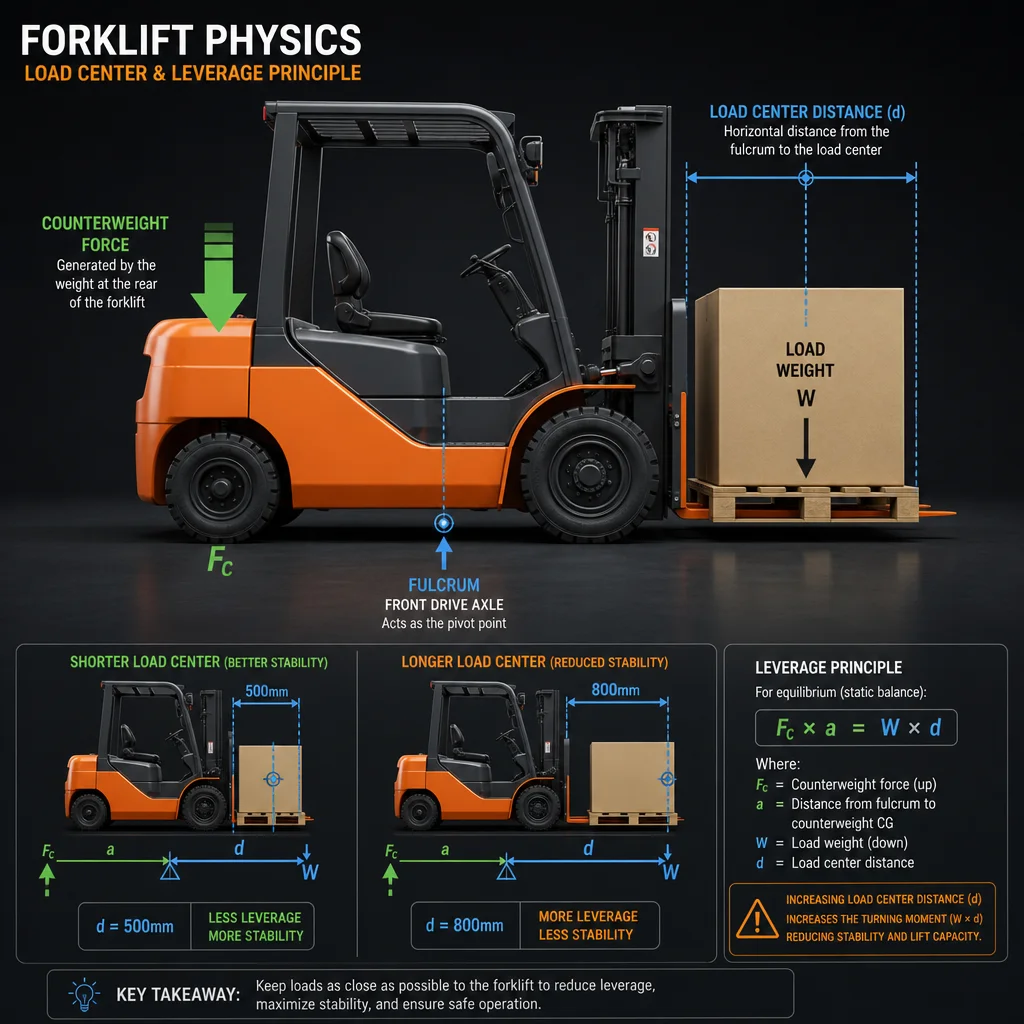
That is why a long load handled on a counterbalance forklift rarely performs the way the plate suggests. Move the same pallet forward by a few hundred millimetres and you can lose a third of your capacity. This is also why the correct engineering response is not always a bigger truck. Sometimes a shorter load center, a different attachment, or a different truck family achieves the same result at far lower cost. Our engineers model this trade-off explicitly; if you want to see how the numbers are worked through, this overview of customized forklift engineering solutions explains the process.
Lift Height Derating: Why Height Costs Capacity
Height derating is the second big variable, and it surprises almost everyone. When you lift a load, the mast, carriage and load all raise the truck’s combined center of gravity. Taller lifts, and especially tall lifts with the mast extended, reduce both forward and lateral stability. Manufacturers therefore publish capacity that decreases as lift height increases. A truck that lifts 2,500 kg to 3,000 mm might be rated at only 1,500 kg at 6,000 mm, even though nothing about the load changed.
Mast type compounds the effect. A two-stage (duplex) mast is generally the most capacity-friendly because it has less structural height and less forward offset. A three-stage (triplex) mast is longer and adds offset, so for the same nominal capacity you often see a lower residual capacity figure. If your specification genuinely needs both high reach and heavy loads, that combination is a design constraint, not a negotiation, and it usually moves you into a different class of truck.
LIFT HEIGHT DERATE CURVE (illustrative, single truck)

Rated
Capacity
 100% |#
      |##
      |###
  75% |####
      |#####
      |######
  50% |#######
      |########
      |#########
  25% |##########
      |###########
      +------------------------------>  Lift height
        3.0m   4.0m   5.0m   6.0m   7.0m

  # = residual capacity available as the load rises.
  Longer = more height = less usable weight.
Attachments Change Everything: The Capacity Impact Matrix
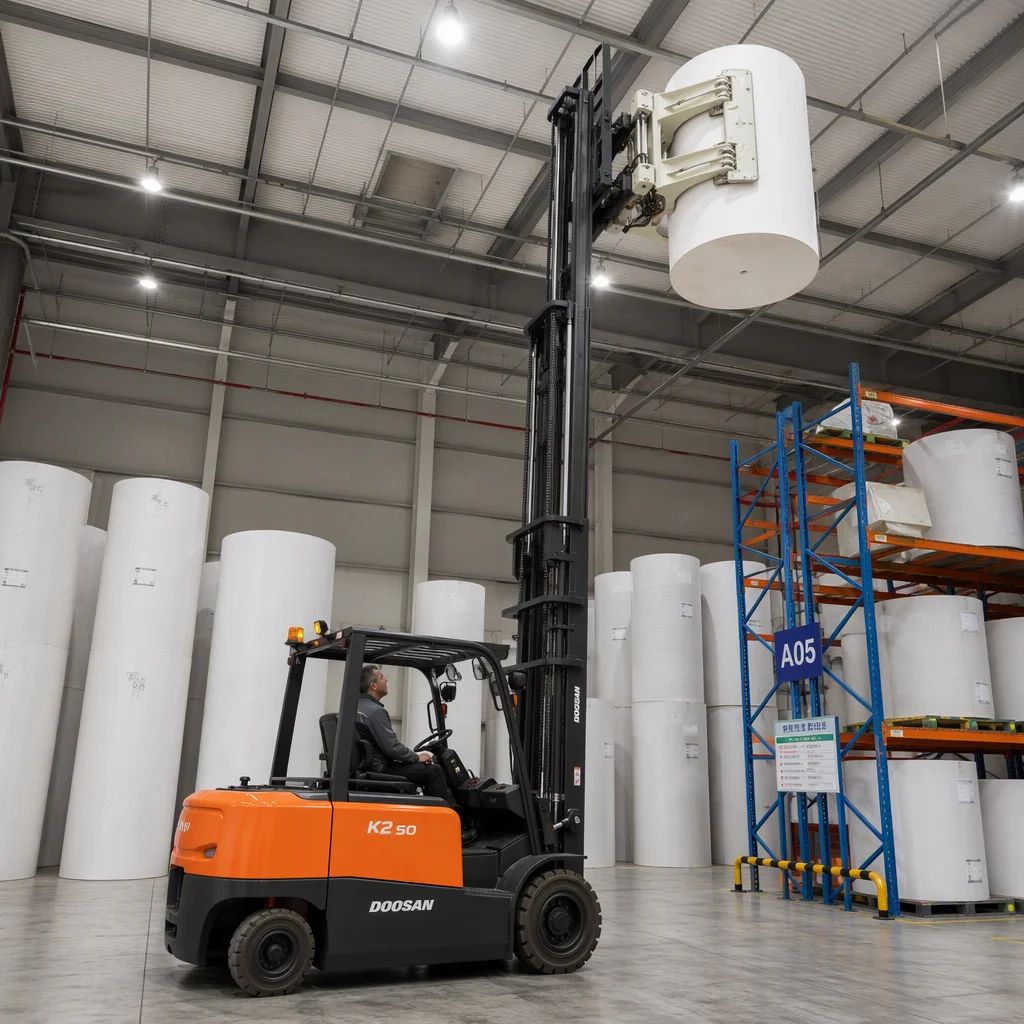
Attachments are where derating gets serious, because an attachment does two harmful things at once. It adds weight that sits ahead of the forks, and it pushes the effective load center forward. The result is a double penalty: the truck must carry the attachment plus the load, and it must do so at a worse leverage point. The table below shows typical capacity impact by attachment type, expressed as an approximate share of the truck’s base rated capacity. Exact figures depend on attachment weight, thickness and the specific truck, so treat this as a planning benchmark and confirm with a load chart.
| Attachment type | Typical added load-center offset | Approx. residual capacity | Best-fit application |
|---|---|---|---|
| Integrated side-shifter (factory) | Minimal (+25–50 mm) | 92–98% | Pallet handling, tight aisles, general warehousing |
| Hook-on side-shifter | Moderate (+50–100 mm) | 85–93% | Retrofit pallet handling where factory integration is not available |
| Fork positioner | Moderate–high (+100–200 mm) | 78–90% | Mixed pallet sizes, variable width loads, high-throughput docks |
| 360° rotator | High (+150–300 mm) | 65–80% | Bin and box dumping, tipping, rotation in process work |
| Bale clamp | High (+200–350 mm) | 60–75% | Baled agriculture, recycling, cotton and straw handling |
| Paper roll clamp | Very high (+250–450 mm) | 50–70% | Paper, print and packaging roll handling, split-roll clamps |
Read that table as a budget, not a verdict. A 3,000 kg truck with a paper roll clamp may only have 1,500–2,100 kg of usable capacity at working heights, which is why roll-handling fleets are usually specified from the attachment backwards. Choose the attachment and the load first, then size the truck so that residual capacity covers the job with margin. If you buy the truck first and add the attachment later, you will almost always be disappointed. If that risk applies to your project, it is worth asking about a customization path early rather than committing to a stock configuration that cannot be derated into compliance.
How to Read a Forklift Load Capacity Chart Correctly
A forklift load capacity chart explained properly is a grid, not a slogan. Good charts show load center across the horizontal axis and lift height across the vertical axis, with residual capacity values filling the cells. Some manufacturers show a family of curves; others show a stepped table. Either way, your job is to find the intersection of your real load center and your real lift height, then read the capacity at that point, and then subtract the attachment penalty if one is fitted.
The mistake is to look only at the top-left corner of the chart, which is the maximum rated capacity at the shortest height and smallest load center. That corner almost never represents your application. The relevant number is usually somewhere in the middle or lower-right of the grid, and it can be 40–60% lower than the headline figure. When I review a customer’s requirements, I ask for five numbers and nothing else, because those five numbers determine everything else.
- Actual load weight, including pallet, packaging and any residual moisture or debris.
- Actual load center in millimetres, measured from the fork face to the true center of gravity.
- Maximum lift height at which the load must be placed or retrieved, not the mast’s maximum reach.
- Attachment configuration, including model, weight and thickness, since each shifts the load center.
- Terrain and duty cycle, because gradients, surfaces and shift intensity change the stability margin you need.
If you can supply those five points, any competent application engineer can give you a defensible capacity figure in minutes. If you cannot, the honest answer is that any number you are quoted is a guess dressed up as a specification.
Real-World Scenarios Where Rated Capacity Fails
The failures I see cluster around a few predictable patterns. A warehouse buys a 3-ton counterbalance truck for standard pallets and it performs beautifully at 4,000 mm. Then the same truck is asked to handle a 1,100 mm load center appliance crate and it tips forward on the forks. A construction customer buys a truck rated at 5 tons, fits a bale clamp, and discovers the effective capacity is closer to 3 tons at height. A rental fleet standardizes on one model and then loses money because attachments cannot be matched to the varied jobs it is hired for.
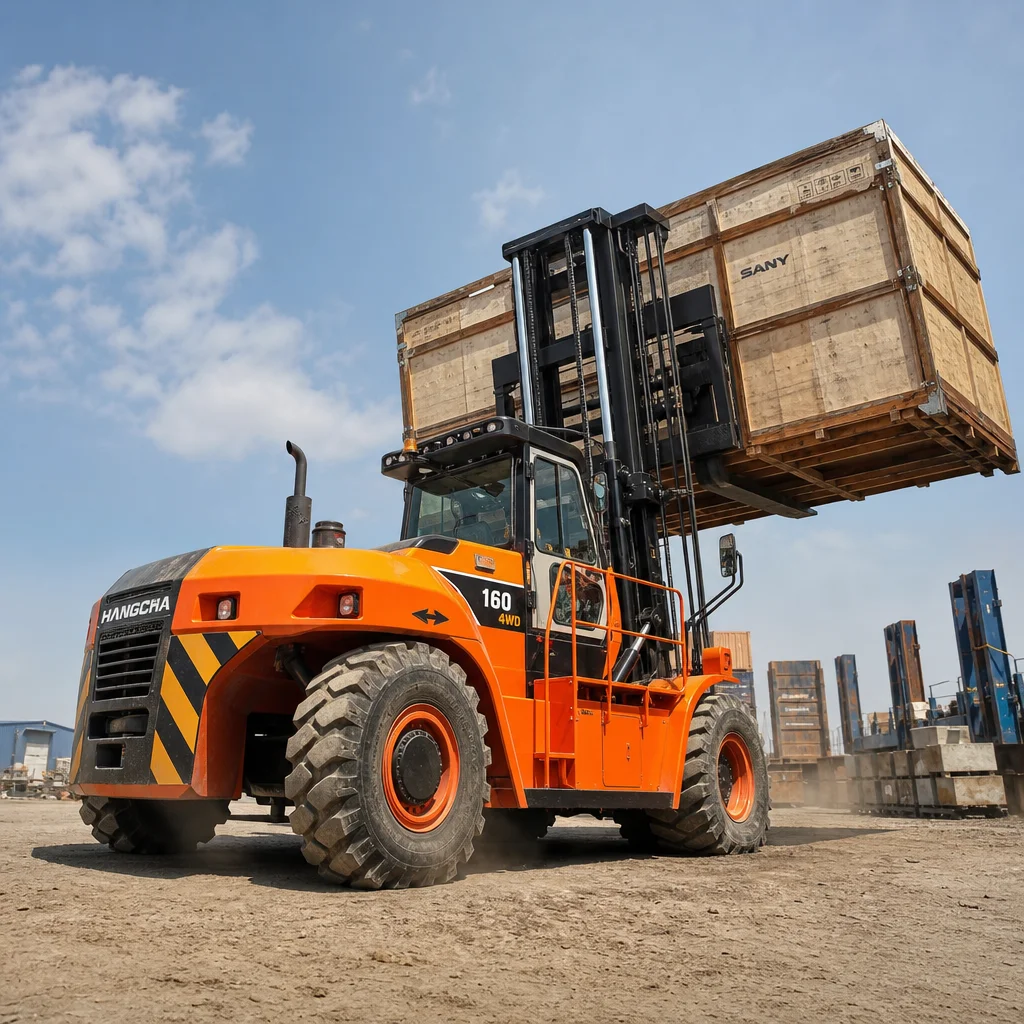
Rough terrain applications deserve special attention. Uneven ground introduces dynamic loads and lateral instability that a flat-floor chart does not model, and gradients add a longitudinal tipping component on top of the load moment. This is why T-series heavy-duty rough terrain forklifts are specified with more stability margin than their flat-floor cousins, and why we always ask about surface conditions and slope before recommending a capacity figure. A number that is safe on a level concrete dock can be marginal on a compacted gravel yard with a five-degree camber.
Commercial Budget & Price Benchmark
Pricing follows capacity, drivetrain and configuration, so a useful benchmark has to be tied to a representative specification: standard forks, a factory side-shifter, a 3-stage mast where applicable, and delivery to a major export port. The table below gives an indicative commercial range for our core families. Treat it as a planning envelope for budgeting and first-pass comparison, not a quotation, since final pricing depends on attachment choice, mast height, tyre type, battery and charger selection, and order volume.
| Model family | Class / power | Typical rated capacity | Indicative budget range (USD) | Typical best-fit use |
|---|---|---|---|---|
| K2 Electric | 2.0–2.5 t, lithium / lead-acid | 2,000–2,500 kg @ 500 mm | $18,000 – $26,000 | Indoor warehousing, cold store, food and pharma, low-noise operations |
| K2 Diesel | 2.0–2.5 t, diesel | 2,000–2,500 kg @ 500 mm | $16,000 – $24,000 | Outdoor yards, long shifts, high-utilisation general handling |
| T30 / T35 | 3.0–3.5 t, rough terrain | 3,000–3,500 kg @ 600 mm | $32,000 – $45,000 | Construction sites, building materials, agriculture, mixed terrain |
| T50 / T70 | 5.0–7.0 t, rough terrain | 5,000–7,000 kg @ 600 mm | $52,000 – $78,000 | Heavy materials, concrete products, timber, port and yard logistics |
| T100 | 10 t class, rough terrain | 10,000 kg @ 600 mm | $95,000 – $140,000 | Oversized cargo, precast concrete, mining support, project freight |
Two patterns matter more than the absolute figures. First, electric and diesel units in the same class sit in a similar bracket, so the energy decision should be driven by duty cycle and indoor/outdoor use rather than by a headline price gap. Second, the jump from a 3.5-ton to a 5-ton rough terrain truck is not linear, because the mast, chassis and hydraulic package all scale together. If your true requirement sits just above the T35 envelope, it is often cheaper to re-specify the load center or attachment than to step up a class. Comparing capacity this way is exactly what a well-chosen Counterbalance Forklift is meant to deliver: matched ability, not surplus tonnage.
The 5-Step Procurement Checklist
Before you sign anything, run the requirement through this checklist. It is deliberately short, because long checklists get ignored. Each step exists to catch a specific class of expensive error, and each one takes only minutes if you have the underlying data.
5-STEP FORKLIFT CAPACITY PROCUREMENT CHECKLIST

[1] MEASURE THE REAL LOAD
    +-- actual weight (load + pallet + packaging)
    +-- actual load center from fork face (mm)
    +-- load dimensions and stability of the unit load

[2] DEFINE THE REAL LIFT PROFILE
    +-- highest placement / retrieval height
    +-- outdoor vs indoor, gradients, surface condition
    +-- travel distance and duty cycle per shift

[3] SELECT THE ATTACHMENT FIRST
    +-- side-shifter / positioner / rotator / clamp
    +-- attachment weight and thickness penalty
    +-- resulting effective load center

[4] READ THE CAPACITY CHART AT THE INTERSECTION
    +-- residual capacity at your center AND your height
    +-- subtract attachment derate
    +-- add a safety margin for dynamic and terrain loads

[5] VERIFY BEFORE YOU COMMIT
    +-- confirm data plate will reflect final configuration
    +-- confirm compliance documents and stability verification
    +-- confirm parts, service and warranty coverage
Steps three and five are where most projects are won or lost. Selecting the attachment before the truck keeps the capacity math honest, and verifying that the final data plate will reflect the delivered configuration keeps you compliant. A truck that is dimensionally perfect but legally mislabelled is a liability, not an asset.
Why Field Data Beats Brochure Data
There is a reason application engineers ask so many questions before quoting. Two customers can describe the same job in identical words and need different trucks. What matters is the data underneath the description: the true weight on the forks, the true center of gravity, the true lift height, the true surface. Brochure capacity flatters every project; field data protects it. When I size a truck, I would rather tell a customer that their headline requirement needs one class up than watch them buy the smaller truck and fight it for five years.
This is also why derating should be documented, not remembered. A capacity chart printed for the delivered configuration, a data plate that matches it, and a short derating note in the operator file together give you something you can hand to a safety auditor or an insurance assessor. Memory is not compliance. Documentation is.
Working With Our Application Engineering Team
If you would rather not do this arithmetic alone, that is exactly what we are here for. Send us the five data points above and we will return a capacity chart plotted against your real load center and lift height, an attachment recommendation with its derate already applied, and an indicative commercial range for the configuration that actually fits. There is no cost to that first review, and it routinely saves customers from buying a truck that is either too small to be safe or too large to be economical.
If your project sits outside our standard ranges, we can engineer to the requirement rather than sell you the nearest catalogue item. Review our customized forklift engineering solutions to see how bespoke masts, attachments, chassis and control packages are developed, or browse the T-series heavy-duty rough terrain forklifts range if your work happens on anything other than a level concrete floor. When you are ready to put numbers on a specific configuration, Contact our application engineering team and we will turn your data points into a chart.
Standards and Regulations You Should Cite
Capacity and stability are governed by standards, and citing them keeps a specification defensible. At the global level, ISO 3691-1 stability verification standards define how trucks are tested for longitudinal and lateral stability under rated and off-center loads. In the United States, OSHA 1910.178 forklift data plate regulations require that trucks are used within the manufacturer’s capacity, that nameplates remain legible, and that any modification affecting capacity triggers an updated plate. For broader technical and safety guidance across the industry, Material Handling Industry technical guidelines are a useful reference point. Build your specification on these foundations and the conversation changes from an argument about opinions to a review of evidence.
A practical tip: whenever you receive a quotation, check that it states the rated capacity, the load center it assumes, the lift height and the attachment configuration. If any one of those four is missing, the number is not yet a specification. Ask for it in writing before you compare suppliers, because a lower price with an undefined load center is not a lower price at all. It is an unquantified risk.
Frequently Asked Questions
Does a higher capacity rating on the plate always mean a stronger truck in practice?
No. The plate rating is defined at one load center, one lift height and one configuration. A truck with a higher headline rating can deliver less usable capacity than a competitor once you move to a longer load center, a taller lift or a heavier attachment. Always compare residual capacity at your real operating point, not the headline number.
How much capacity do I lose when I add an attachment?
It depends on the attachment. A factory integrated side-shifter might cost only 2–8% of capacity, while a paper roll clamp can cost 30–50% once its weight and forward offset are accounted for. Use the attachment matrix above as a planning benchmark, then confirm against a chart plotted for the specific truck and attachment combination.
Why does lift height reduce capacity if the load weight never changes?
Because lifting raises the combined center of gravity of the truck and load, which reduces both forward and lateral stability. Manufacturers therefore publish lower capacity as height increases. The load is identical; the stability envelope is not.
Can I just buy a bigger truck instead of derating?
Sometimes, but it is often the most expensive solution. Re-specifying the load center, choosing a lighter attachment, or selecting a different mast frequently restores usable capacity at a fraction of the cost of stepping up a class. There are cases where a larger truck is genuinely required, and we will tell you when that is true, but it should be the conclusion of the analysis, not the starting assumption.
What information do you need to give me an accurate capacity recommendation?
Five things: actual load weight, actual load center, maximum lift height, attachment configuration, and terrain plus duty cycle. With those, we can plot capacity against your operating point, apply the attachment derate, and quote a configuration that matches the job with a sensible safety margin.
The Bottom Line
Forklift load capacity is not a single number, it is a relationship between weight, distance and height. Load center derating, lift height derating and attachment penalties all pull in the same direction: away from the headline figure and toward the real one. Buyers who understand that relationship get trucks that do the job quietly for years. Buyers who do not get surprises on the loading dock.
Measure honestly, choose the attachment before the truck, read the chart at the intersection, and verify before you commit. Do that and the capacity number on your data plate will finally mean what you always assumed it meant. If you would like us to run the numbers for your application, our team is ready when you are.